Import trace data
Open files, folders, gzip logs, ZIP, TAR, TAR.GZ, TGZ, and nested archive bundles, packet captures, normalized TranslatorX exports, or text copied to the clipboard.

A desktop application for reading, filtering, correlating, and visualizing signaling logs from Cisco collaboration systems and related endpoints.
Released August 24, 2026
Version 26.1.3 promotes the verified beta feature set to Stable, with CUBE live-trace improvements, Imagicle OPAL support, precise SDP labels, and Q.850 cause explanations.
Functions
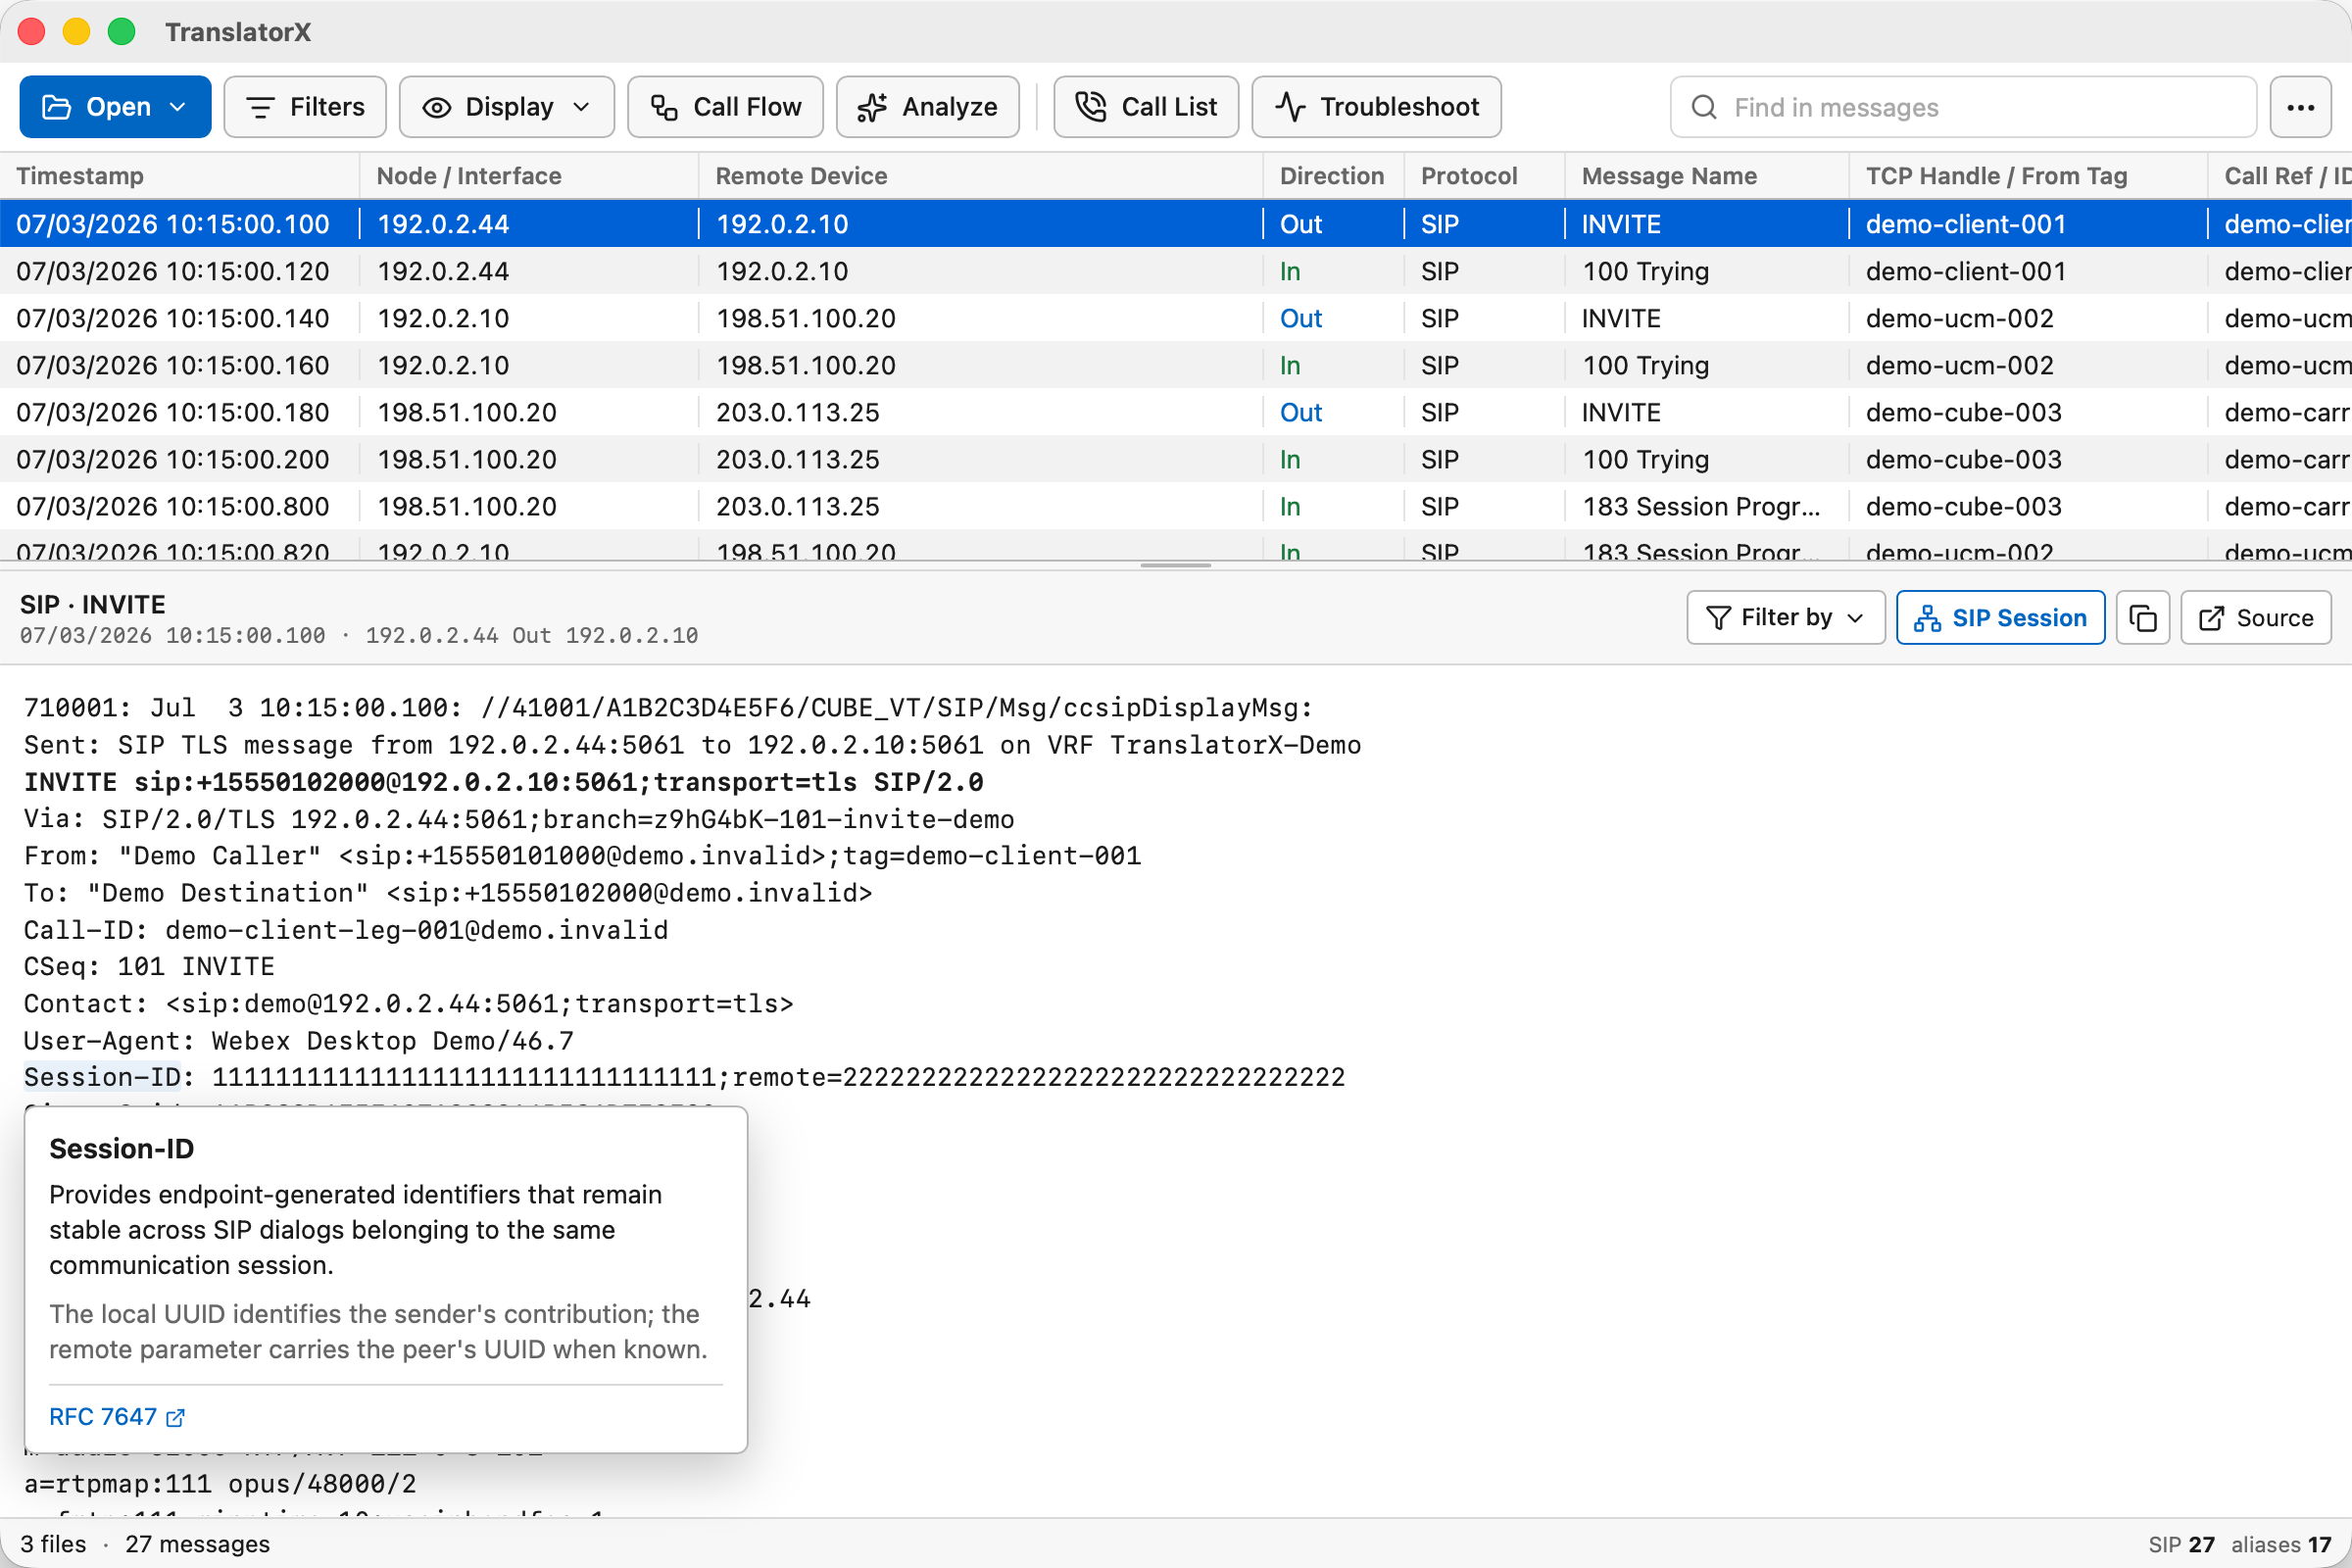
The application keeps the original protocol detail available while adding a normalized view across different products and log formats.
Open files, folders, gzip logs, ZIP, TAR, TAR.GZ, TGZ, and nested archive bundles, packet captures, normalized TranslatorX exports, or text copied to the clipboard.
Normalize timestamps to GMT, infer source timezones and missing years, and allow per-source time overrides when automatic alignment is not correct.
Use text search, structured reusable filters, protocol visibility, routine-traffic controls, and decoded details for supported signaling protocols.
Review Unified CM CDR records, trace-derived SIP calls, and multi-leg sessions correlated by explicit identifiers, with a directed topology for retries, forks, transfers, and transit hops.
Follow messages between endpoints, Unified CM, CUBE, Expressway, and other systems in a chronological call-flow window with editable device labels and lanes.
Decode endpoint, Webex App, CUBE, RFC 6035, and Unified CM CMR statistics; preserve the raw reports; and explain supported loss, jitter, delay, and reconciliation results.
Collect a timeframe from Unified CM, CUBE, or Expressway; coordinate multiple devices; or run live CUBE and Expressway traces.
Optionally analyze a SIP call, session, or filtered trace using Ollama, Anthropic, AWS Bedrock, or a custom endpoint compatible with Anthropic Messages or OpenAI Chat Completions.
Create readable text, a normalized re-importable trace, a call-flow diagram, or a portable AI analysis report in Markdown or PDF.
Main workspace
Select a marker to see how the main TranslatorX window supports common investigation tasks.
Compatibility
Support depends on the information present in each source. Summary-only logs can be correlated and displayed, but cannot provide message bodies that were never recorded.
.txtrace files exported by TranslatorXCall List
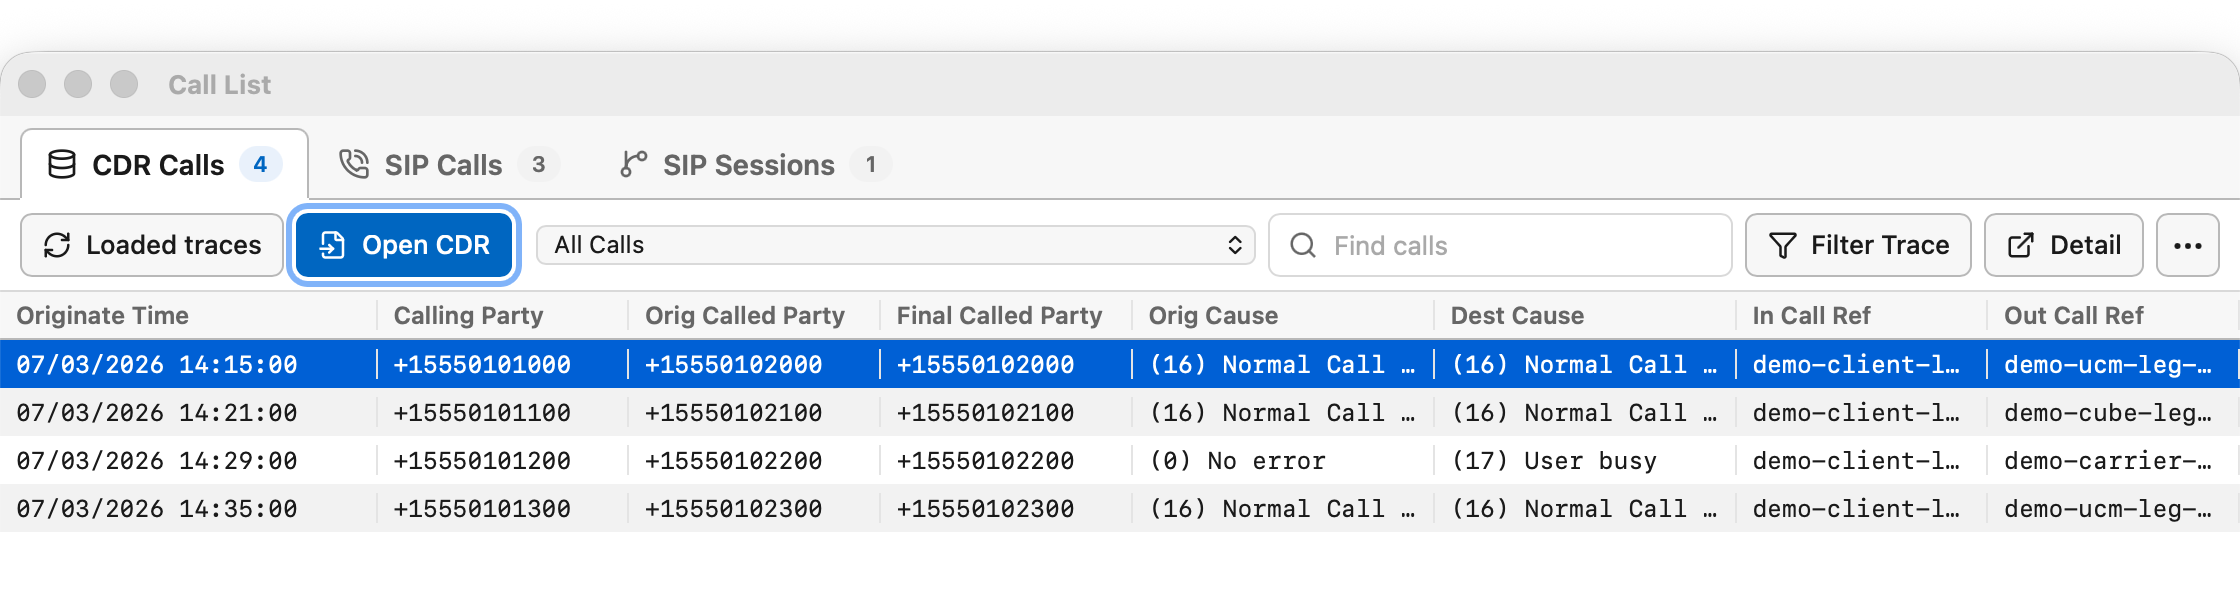
TranslatorX separates standalone or embedded Unified CM CDR records from calls and sessions derived automatically from the signaling messages in the loaded traces.
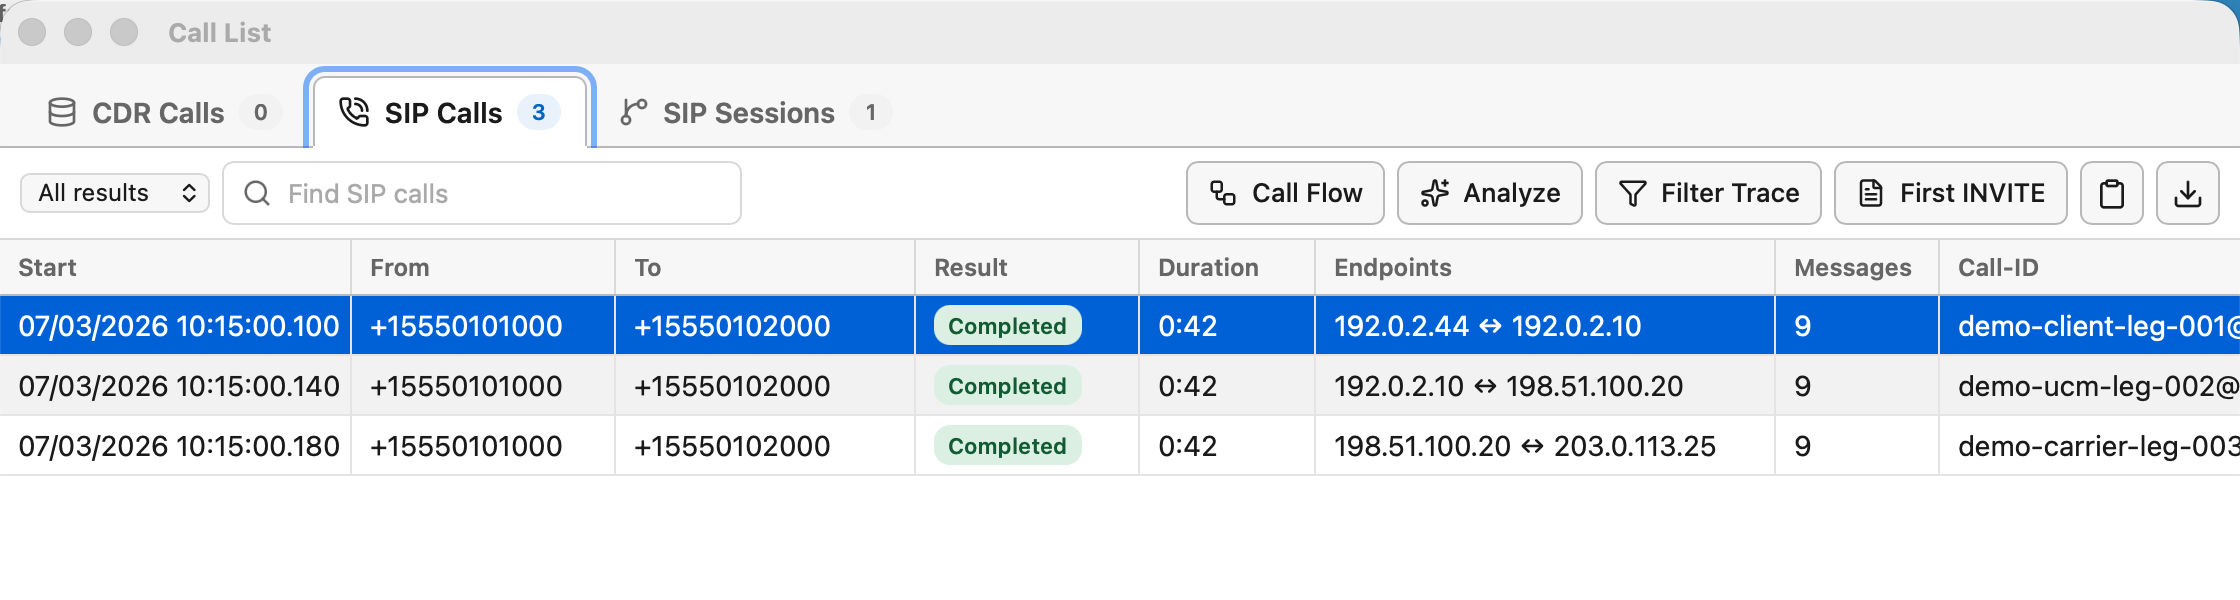
Initial INVITEs are grouped by Call-ID with participants, result, duration, observed endpoints, and message counts. A selected call can be filtered, analyzed, or opened directly in Call Flow.
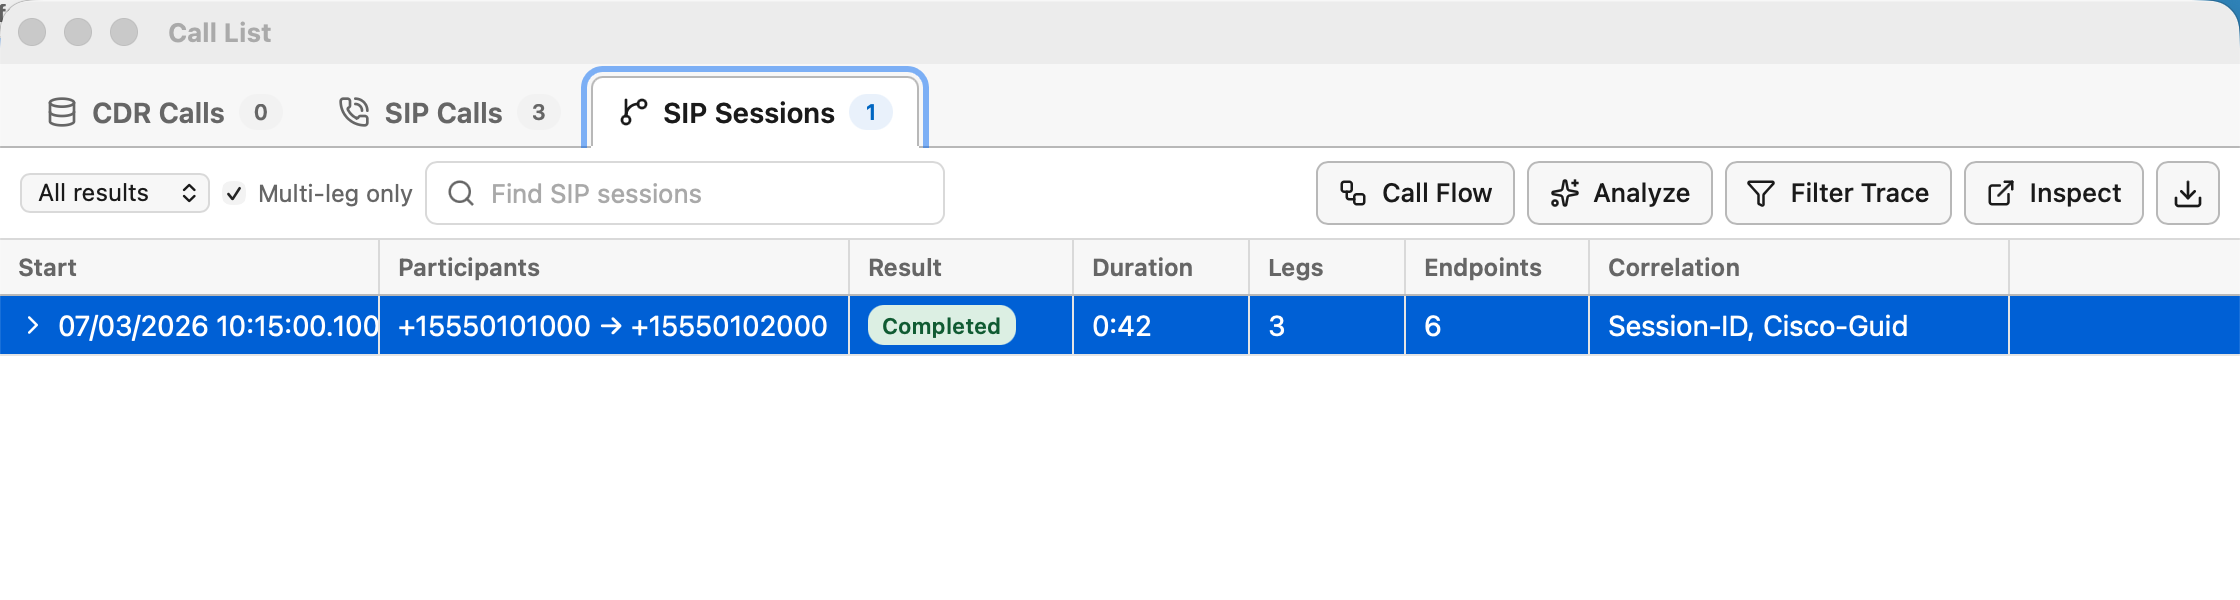
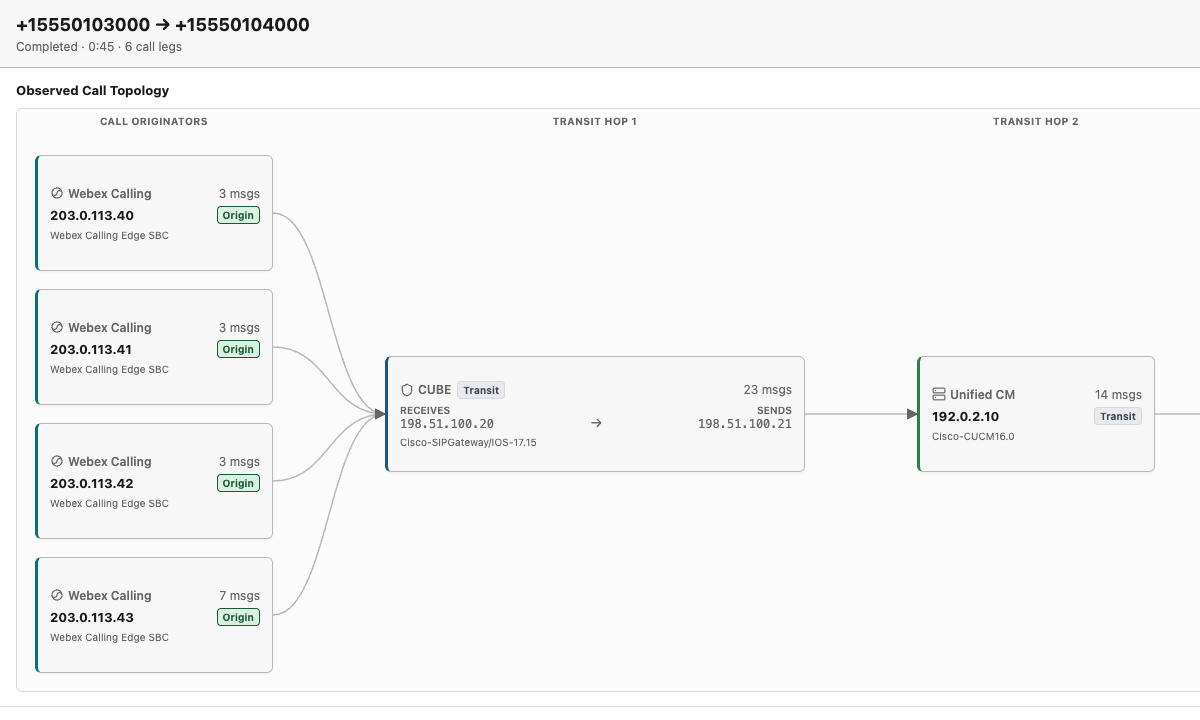
Related call legs are correlated through explicit Session-ID and vendor identifiers. Open the Session Inspector to see their directed topology, numbered legs, media evidence, and event timeline without relying on phone-number or timing heuristics.
Embedded and standalone CDR files remain available in their own tab with decoded disconnect causes, search, trace filtering, and complete record details.
Call Flow
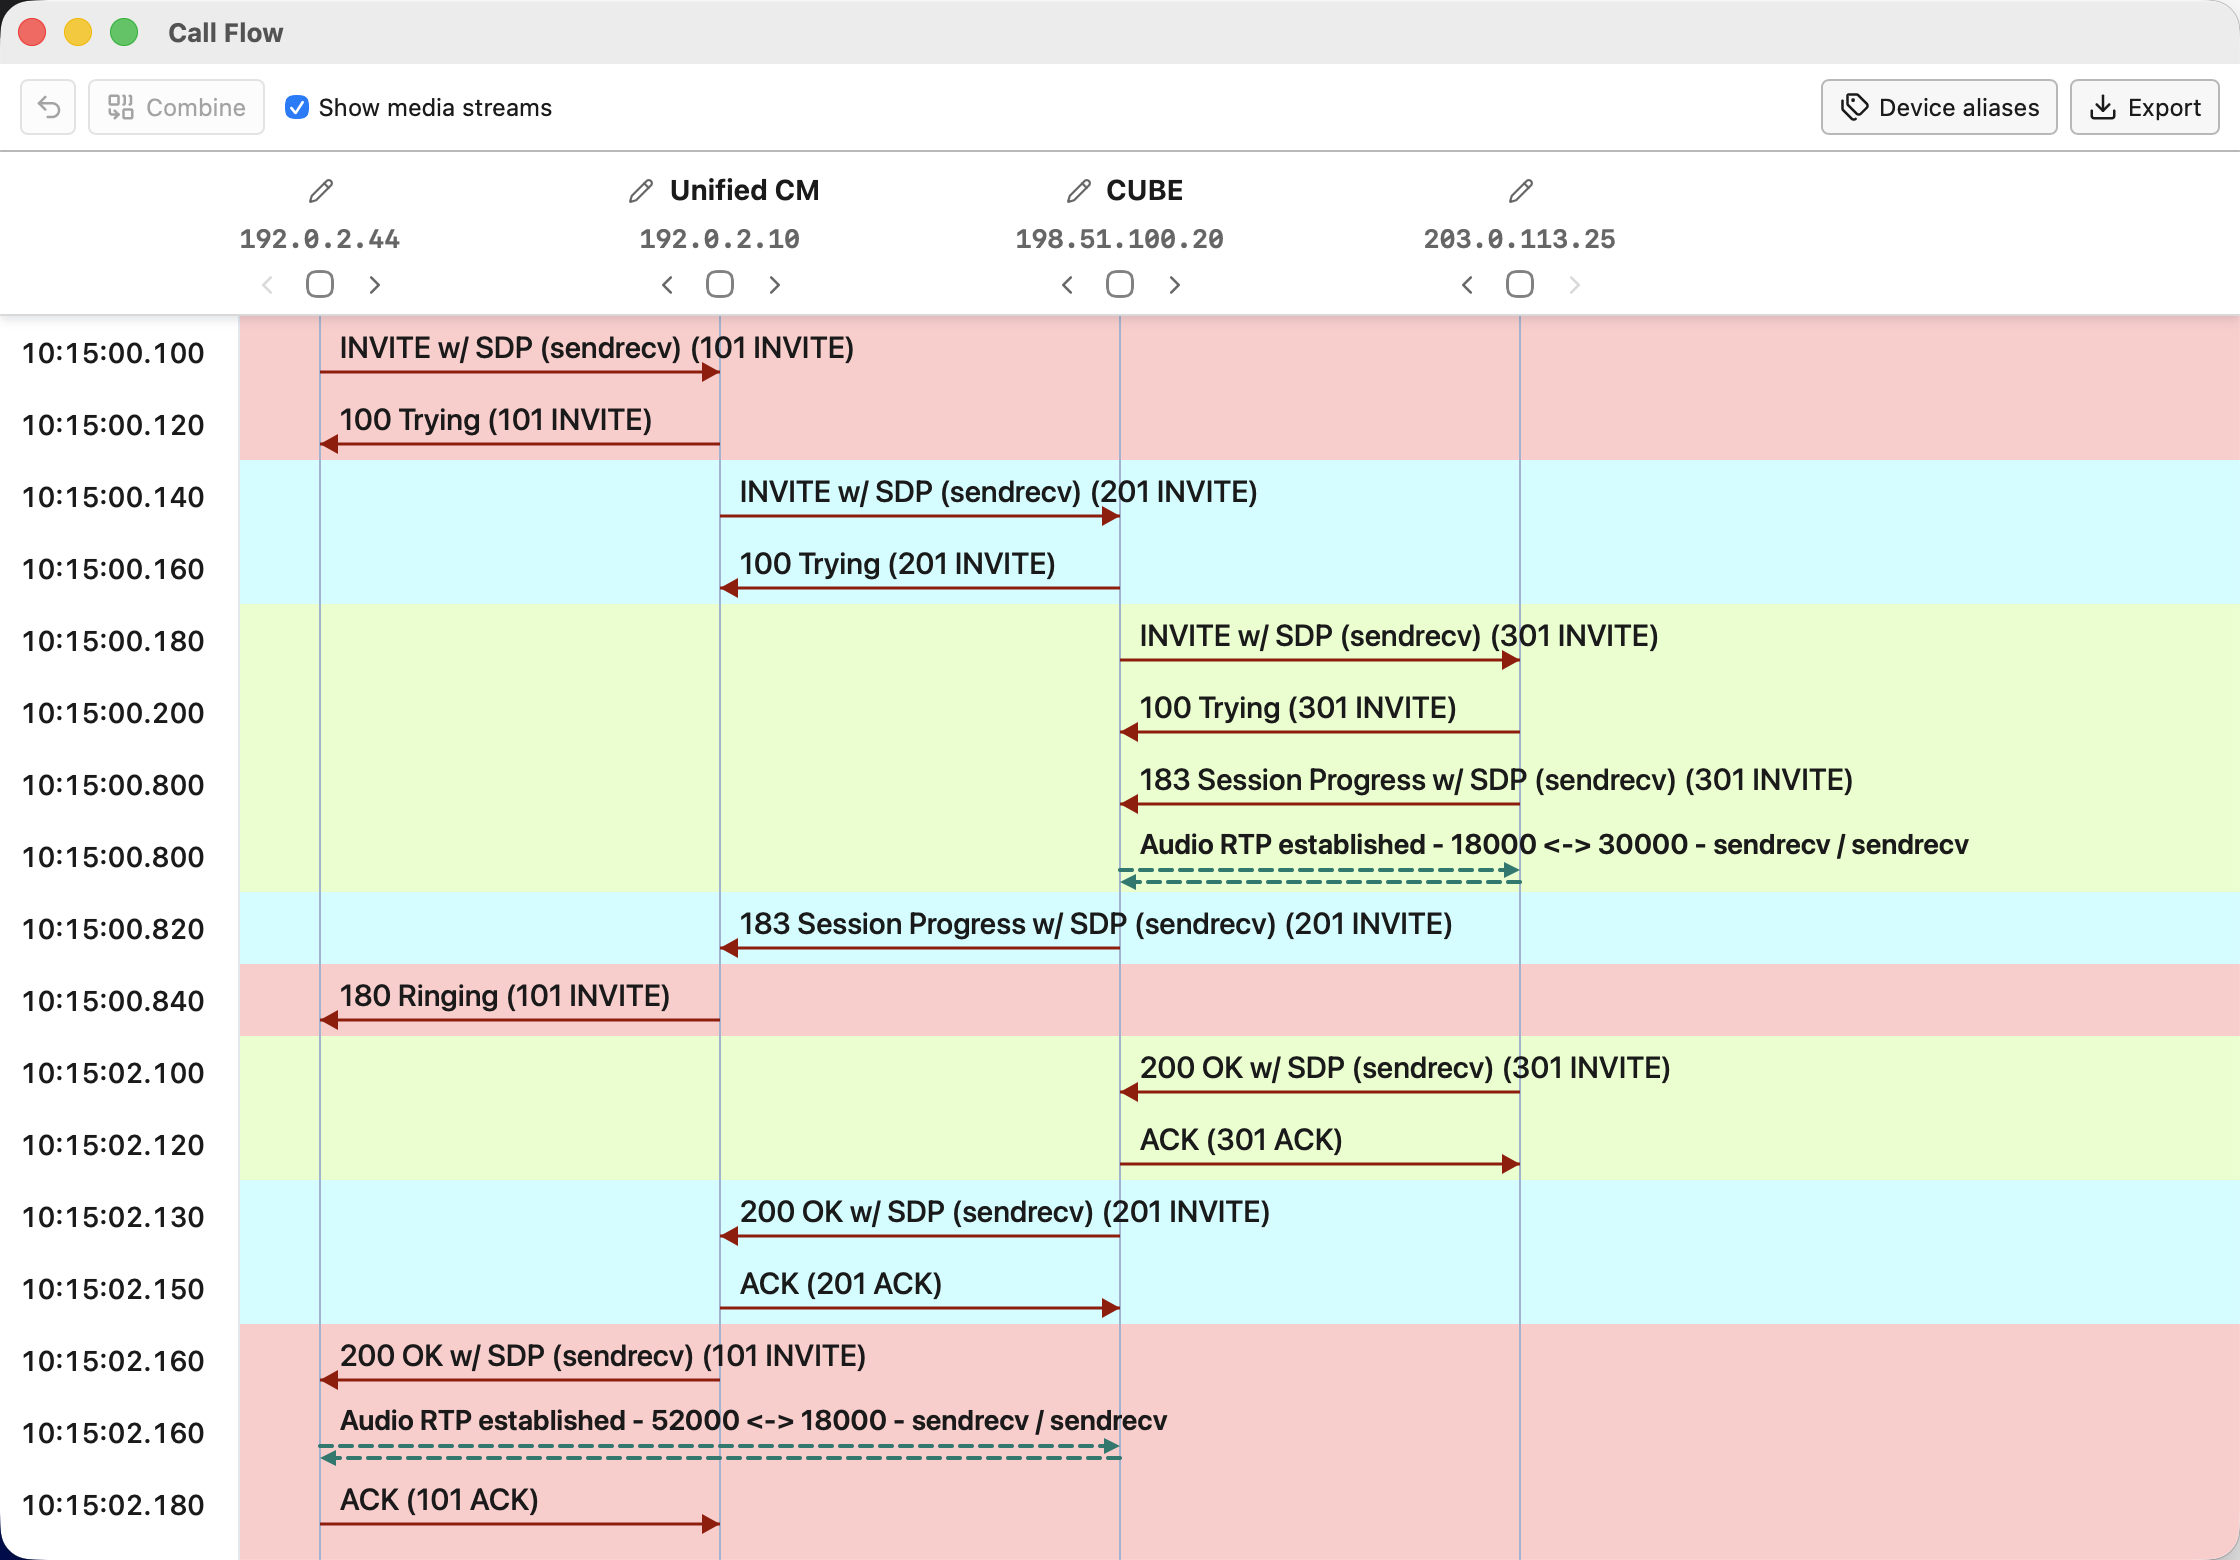
Follow signaling chronologically as a call moves between endpoints, Unified CM, CUBE, Expressway, and service-provider systems. Select any row to inspect its decoded message while retaining the complete flow as context.
SIP Session Inspector
See how retries, forks, transfers, and transit hops branch across a correlated session.
Media quality evidence
Established Media Streams bring supported Cisco phone and Webex App statistics, CUBE P-RTP-Stat, RFC 6035 reports, and Unified CM CMR evidence into one explainable view while keeping every source report available.
bps rates, raw fields, and safe TX/RX comparisons make the evidence easier to verify.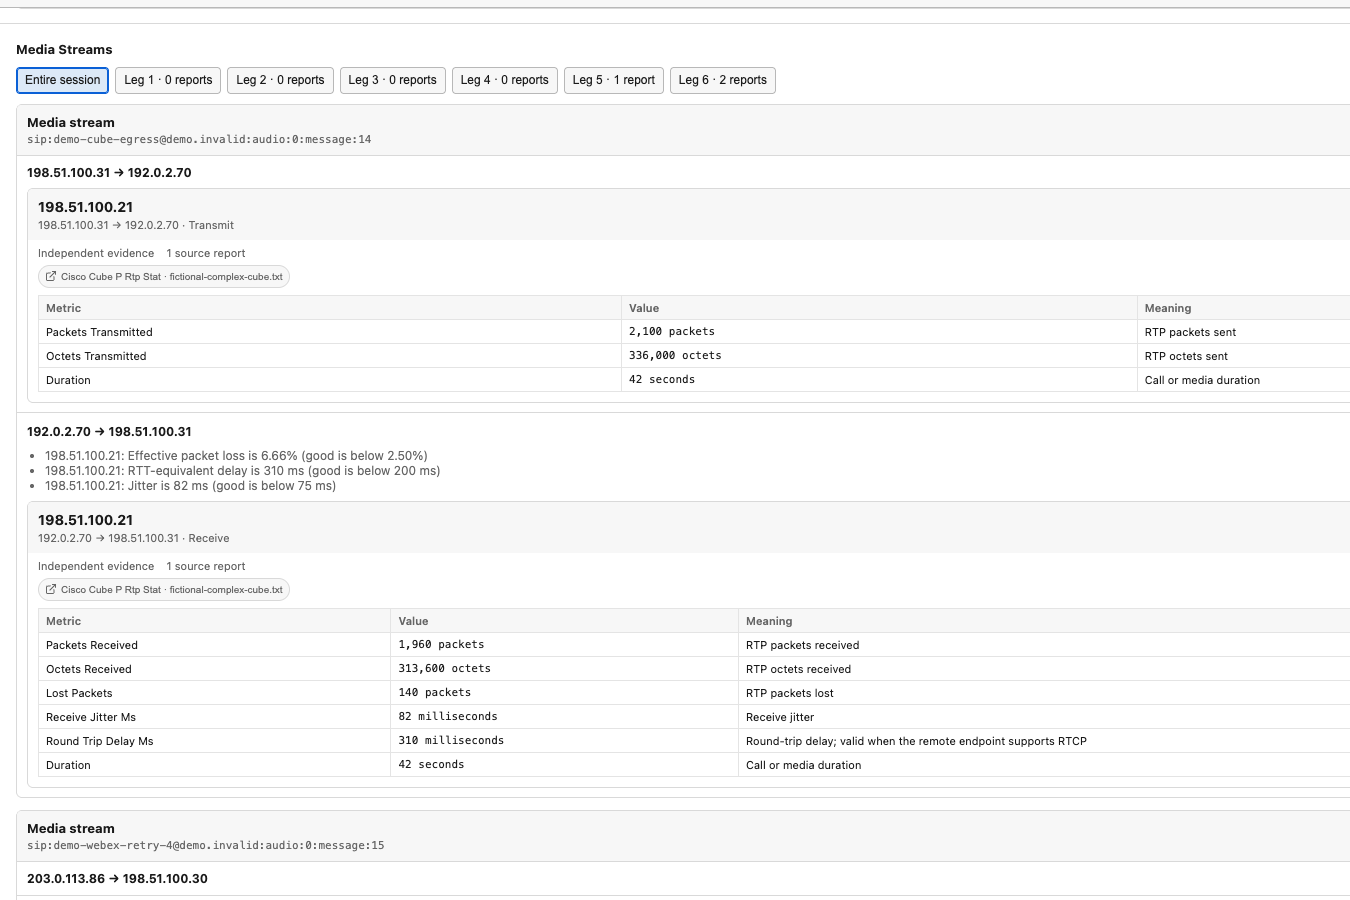
Remote Collection
Saved connection profiles support focused historical collection, coordinated collection across products, bounded troubleshooting sessions, and real-time tracing.
Collect a relative or absolute timeframe from one Unified CM, CUBE, or Expressway profile. A Unified CM publisher profile discovers and collects every cluster node.
The incident time is known and one product contains the evidence you need.
Unified CM, CUBE, Expressway
Apply one relative or absolute timeframe to several saved profiles. Independent collectors run in parallel and the results open as one correlated timeline.
A known incident crossed product or network boundaries.
Unified CM, CUBE, Expressway
Select the participating systems, start the session, reproduce the issue, and stop. TranslatorX records the exact interval and coordinates Expressway diagnostic capture.
The issue can be reproduced now and the relevant devices are known.
Unified CM, CUBE, Expressway
Stream signaling from one or more CUBE and Expressway profiles. Incoming messages immediately update filters, call analysis, and open call-flow windows.
You need to watch signaling and calls while the issue occurs.
CUBE, Expressway
Data handling
Parsing, filtering, correlation, call-flow generation, and export run on the local computer. Remote collection connects only to profiles selected by the user.
Saved credentials are kept in the operating system credential manager. SSH host keys and HTTPS certificates that are not already trusted must be reviewed before use; accepted HTTPS certificates are pinned to the selected origin.
Local Ollama analysis does not send trace evidence off the computer. Cloud providers receive evidence only after the user starts an analysis. Cloud identifier anonymization is enabled by default and can be disabled when organizational policy permits it.